
MARKETMAZE · ECOMMERCE TOOLS · RESEARCH
12 Best Ecommerce Analytics, Profit Tracking & Attribution Tools (2026)
Ecommerce measurement tools explain what is happening across the store, customers, marketing and margin. The hard part is choosing the right measurement layer: native reporting, profit intelligence or advertising attribution, because those jobs answer different questions and should not be treated as interchangeable.
Research checked 26 September 2026 against official vendor sources.
New to this category? Start with four concepts. Native analytics reports what the commerce platform already knows about orders, products and customers. Profit analytics adds costs so revenue can be translated into contribution economics. Attribution assigns conversion credit across marketing touchpoints, while incrementality asks a harder causal question: what sales would not have happened without the marketing. Google Analytics 4 (GA4), for example, can show acquisition paths and ecommerce events, but that does not make it a financial ledger or prove an ad caused a sale. Decide which question matters before comparing dashboards.
🧭 Jump to a tool
🏆 The quick answer
Triple Whale
Best all-round ecommerce-native measurement workspace.
Polar Analytics
Best when the data foundation matters as much as the dashboard.
Northbeam
Best for high-spend teams making budget-allocation decisions.
Shopify Analytics
Best first stop before paying for overlapping reporting.
Lifetimely by AMP
Best operator view of profit and customer lifetime value.
ThoughtMetric
Best lower-cost step up from platform-reported attribution.
MarketMaze take: Do not run one giant feature comparison. First decide which lane you are buying: store-native reporting, profit/business analytics or advertising measurement. Then make finalists process the same period of real data and compare where numbers diverge. The most useful tool is the one whose data model matches the decision you need to make. A beautiful attribution dashboard is a poor substitute for complete cost data, and a perfect profit report cannot by itself prove media incrementality.
📊 Tool comparison & scores
Rank | Tool | Score | Best for | Pricing |
|---|---|---|---|---|
1 | 94/100 | Ecommerce brands that want attribution, business intelligence and marketing measurement in one operating layer | Custom quote for paid Foundation, Automate and Enterprise packages; a Free plan is available | |
2 | 92/100 | Mid-market brands that want a managed ecommerce data foundation, semantic layer and business intelligence across many sources | Core starts at $750/month for brands under $5M impacted annual GMV and scales with GMV; Custom plan available | |
3 | 91/100 | Brands with substantial paid-media spend that need serious first-party attribution and advanced media measurement | Starter shown from $1,500; Professional $3,500/month; Growth and Enterprise are custom quote | |
4 | 89/100 | Mature marketing teams that need multi-touch attribution, marketing mix modeling and incrementality within one measurement program | Custom quote | |
5 | 88/100 | Commerce teams that want a managed data-integration and analytics layer across marketing, finance and operations | Starter Essentials $1,499/month; Essentials $1,999/month; Enterprise custom quote | |
6 | 87/100 | Shopify-centric brands that want profit and customer lifetime value analysis without building a data warehouse | Free below 50 orders/month; paid plans scale by orders, including M at $149/month through Unlimited at $999/month | |
7 | 86/100 | Shopify merchants that need the cleanest native baseline for sales, sessions, products and store operations | Included with Shopify; Basic starts at $29/month billed yearly ($39 month-to-month), with higher Shopify plans adding platform capabilities | |
8 | 85/100 | Teams that need free cross-site and app journey analytics, acquisition reporting and an extensible event model | Standard Google Analytics is free; Analytics 360 is custom quote | |
9 | 84/100 | Amazon sellers that need inexpensive, detailed profit visibility around fees, advertising and inventory | Standard $19/month ($15 annual); Professional $29; Business $39; Enterprise $79; annual discounts available | |
10 | 83/100 | Brands that want true-profit dashboards with product, order, shipping, returns and marketing cost analysis | Custom quote; all plans include a 14-day free trial | |
11 | 82/100 | Commerce teams that want broad KPI reporting, customer segmentation and a managed data pipeline option | Custom quote; Glew Pro requires annual prepayment and Glew Plus has custom pricing | |
12 | 81/100 | Smaller ecommerce brands that want straightforward multi-touch attribution with transparent entry pricing | From $99/month for 50,000 monthly pageviews; every feature included, with annual savings available |
🧠 How the scoring works
This ranking uses MarketMaze proprietary scoring.
Every tool is scored on the same six weighted dimensions. For this page, core job performance emphasizes data accuracy, useful channel coverage, cost completeness, attribution or profit logic appropriate to the tool’s lane, dashboard usefulness and cohort or customer analysis where relevant.
Dimension | Weight | What it means here |
|---|---|---|
Core job performance | 30% | Accuracy and usefulness for the tool’s native, profit or attribution job. |
Ecommerce fit | 20% | Depth of store, product, customer, marketplace and commerce workflows. |
Workflow & control | 15% | Practical daily analysis, model control, segmentation and reporting flexibility. |
Integrations & implementation | 15% | Source coverage, data flow, application programming interface (API) options and setup burden. |
Pricing & value | 10% | Transparency and value for the buyer the product naturally serves. |
Scale & advanced capabilities | 10% | Warehousing, modeling, experimentation, governance and larger-team needs. |
🤔 Do you even need ecommerce analytics, profit tracking or attribution software?
You spend materially across several channels, reconcile multiple stores or marketplaces, or cannot explain profit by product, customer or channel without spreadsheet work.
Your native platform answers most questions, but paid-media scale, cost allocation or cross-source reporting is starting to create recurring manual work.
You run one small store, low ad spend and simple operations, and Shopify Analytics or GA4 already answers the decisions you actually make each week.

1. Triple Whale
94/100 · 💰 Premium · 🧩 Intermediate · 🏢 SMB–Mid-market · ⚙️ Low-code
🎯 Best for: Ecommerce brands that want attribution, business intelligence and marketing measurement in one operating layer.
⚡ Choose Triple Whale if you want one ecommerce-native measurement workspace that connects channel attribution with broader operating data.
Triple Whale is built around ecommerce measurement rather than generic web reporting. Its attribution layer uses the Triple Pixel and multiple attribution models, while the broader platform adds business intelligence, custom dashboards, customer segments and advanced measurement options. It is strongest when marketing teams need to reconcile platform-reported performance with a first-party view and then use the same data for budget, creative and merchandising decisions.
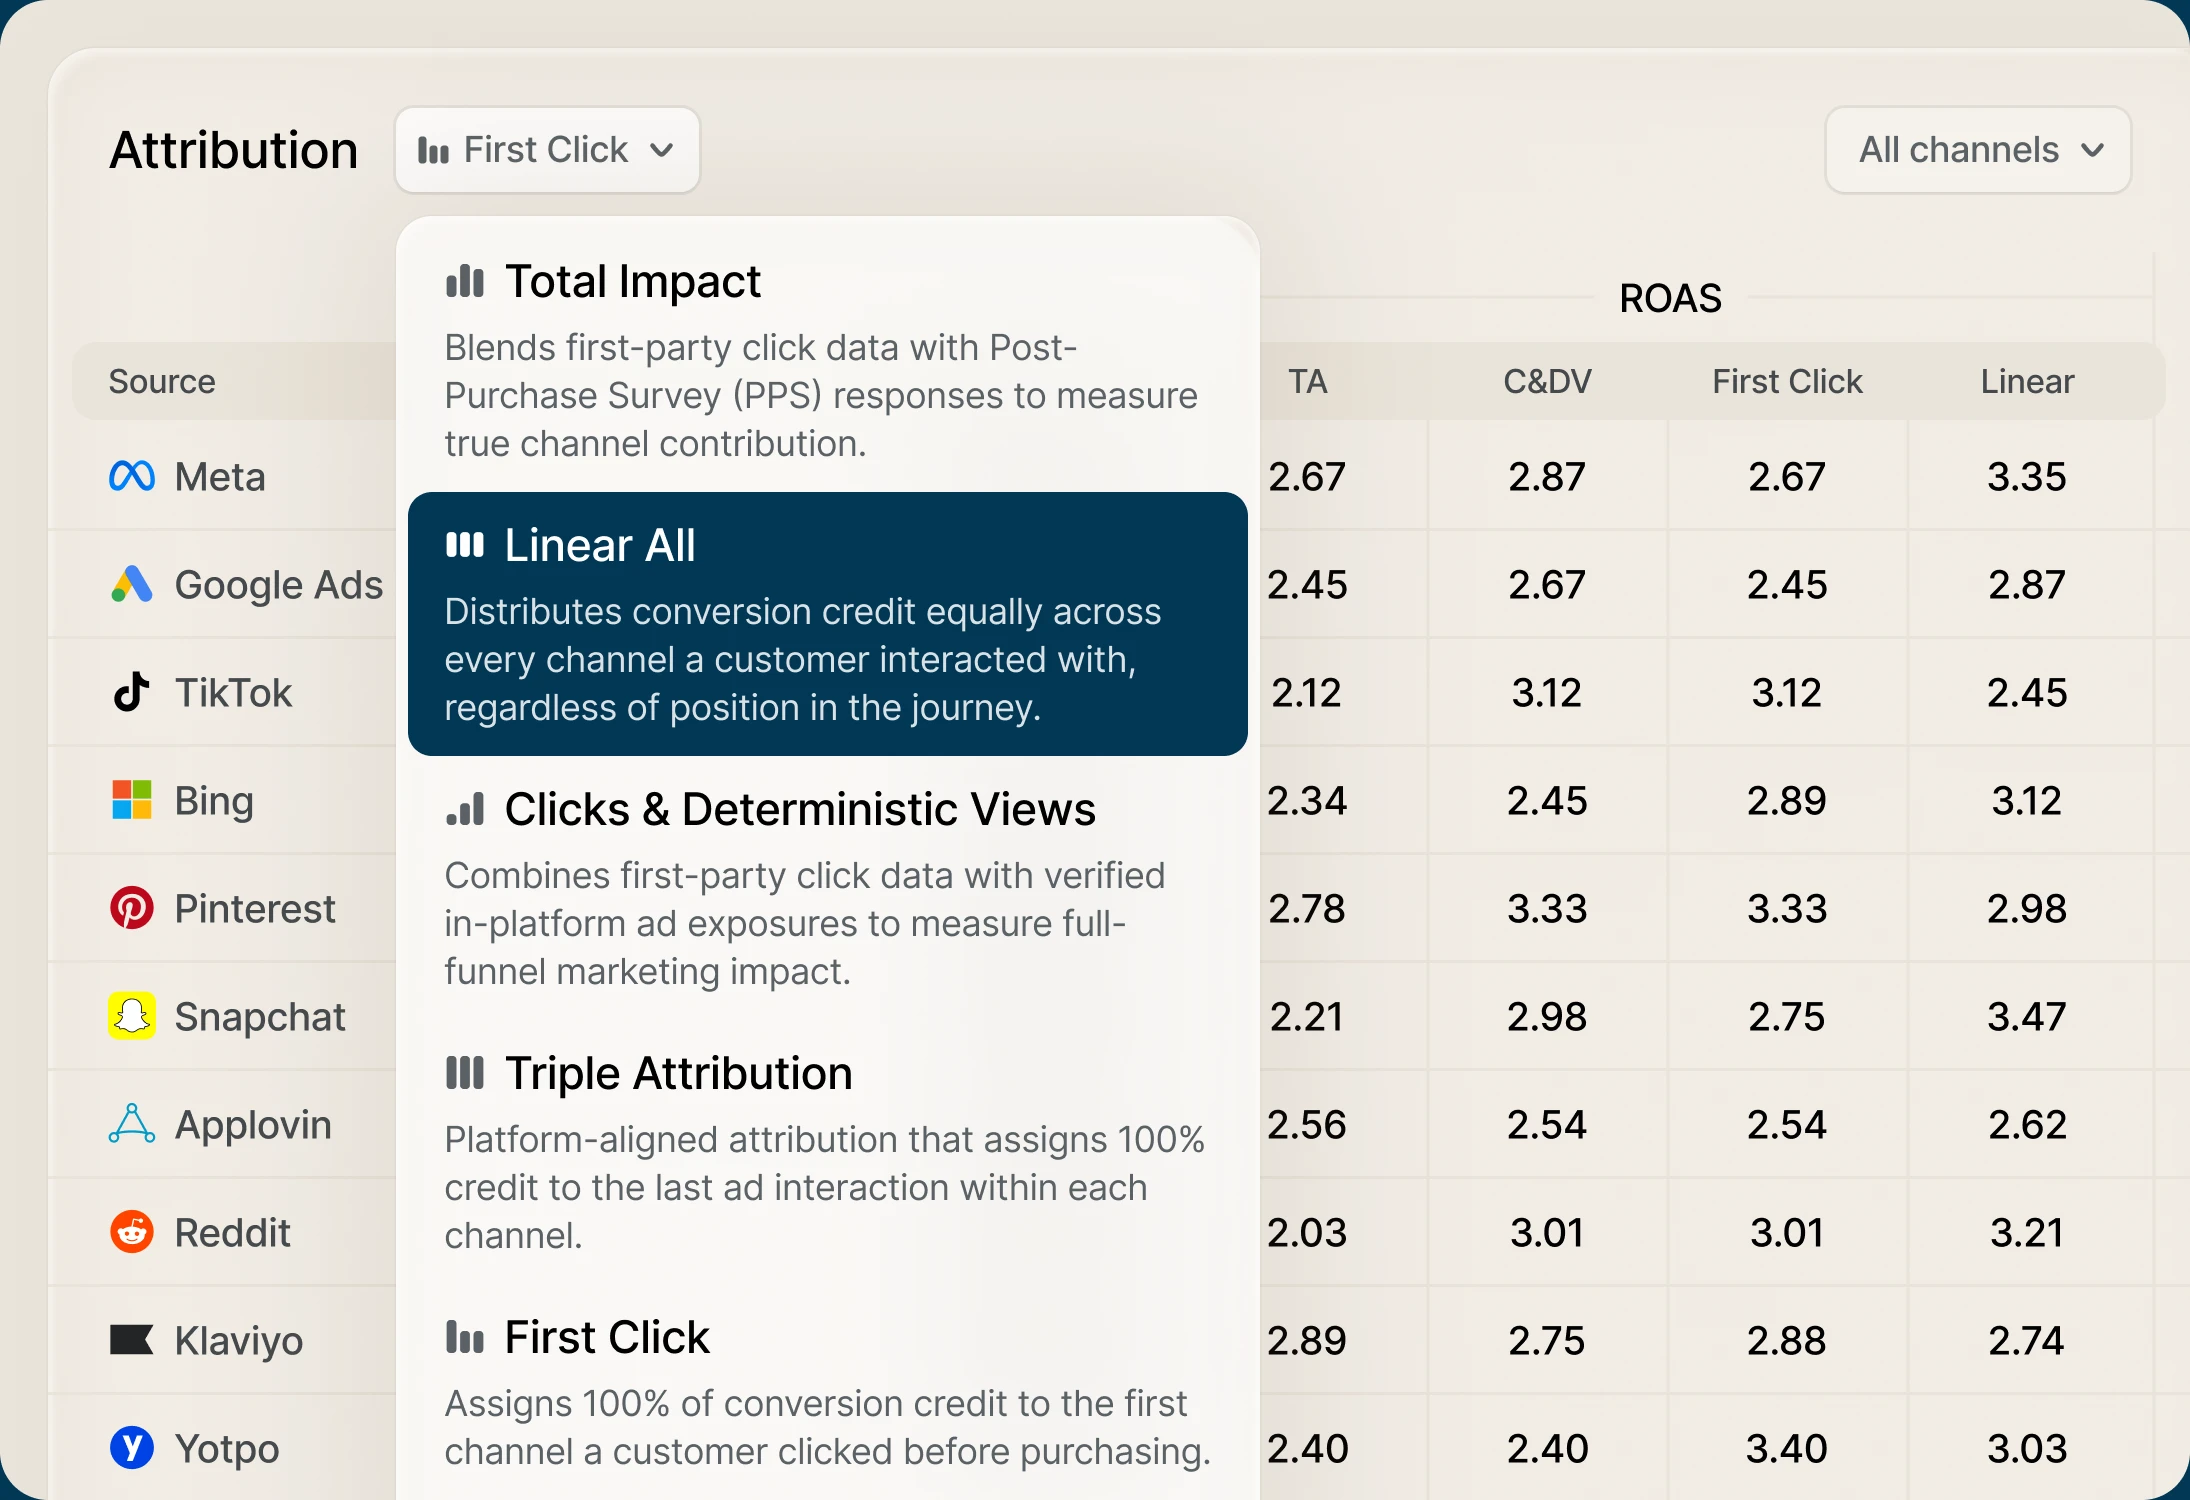
📷 Triple Whale attribution-model view showing how operators can switch measurement logic inside the product. Source: official vendor website/documentation.
💚 What we like
Seven attribution models cover single-touch and multi-touch views without locking the team into one answer.
The same platform connects attribution with custom business-intelligence dashboards and customer segments.
Enterprise packages add Compass for marketing mix modeling and incrementality alongside attribution.
🟠 What to know
Paid pricing is based on annual gross merchandise value and package, so serious buyers need a quote rather than a simple public rate card.
Measurement quality still depends on disciplined tracking, channel tagging and enough clean conversion data; changing models does not remove methodological trade-offs.
💡 Why this score: The score reflects unusually strong ecommerce fit and a broad measurement stack that goes beyond a single attribution report. Triple Whale loses points on pricing transparency and because advanced measurement still requires thoughtful setup, but its day-to-day operator workflow is unusually cohesive for the category.
💰 Pricing: Custom quote for paid Foundation, Automate and Enterprise packages; a Free plan is available
✅ Best fit: Growing ecommerce brands with meaningful paid-media spend, multi-channel teams and a need to connect acquisition data with store economics.
🚫 Less ideal for: Very small stores that only need native store reporting, or teams seeking a formal accounting ledger rather than measurement and business intelligence.
🧩 Key capabilities
First-party Triple Pixel measurement
Seven attribution models and configurable windows
Custom business-intelligence dashboards
Customer and audience segmentation
Data warehouse exports
Marketing mix modeling and incrementality on advanced packages
🔎 Official sources: Product · Pricing · Documentation / feature / integration

2. Polar Analytics
92/100 · 💰 Premium · 🧩 Advanced · 🏢 Mid-market–Enterprise · ⚙️ Specialist-led
🎯 Best for: Mid-market brands that want a managed ecommerce data foundation, semantic layer and business intelligence across many sources.
⚡ Choose Polar Analytics if your real problem is fragmented commerce data, not only ad attribution, and you want a dedicated data layer without building one from scratch.
Polar Analytics sits closer to an ecommerce data platform than a dashboard app. Core combines a dedicated Snowflake database, ecommerce semantic layer, first-party pixel, business intelligence and data activation features, with a broad connector catalog. That makes it useful for teams that need consistent definitions across finance, marketing, product and operations. It can also support incrementality testing, but the buying decision should start with data architecture and governance rather than pretty charts.

📷 Polar Analytics interface illustrating profit-focused ecommerce reporting across connected business data. Source: official vendor website/documentation.
💚 What we like
A dedicated Snowflake database and ecommerce semantic layer create a stronger shared data foundation than dashboard-only tools.
Connector coverage spans commerce, advertising, customer, finance and operational sources.
Custom configurations can add incrementality testing, AI agents and data activations without replacing the underlying data model.
🟠 What to know
Core pricing is GMV-based and starts at a premium level, so the economic case improves when multiple teams reuse the data stack.
A shared semantic layer is valuable only when metric definitions, source ownership and governance are actively managed by an internal owner.
💡 Why this score: Polar scores extremely well for ecommerce fit, integrations and cross-functional control. It ranks just behind Triple Whale because the implementation is heavier and the starting price is higher for smaller brands. For teams that need a durable commerce data layer, those trade-offs can be entirely rational.
💰 Pricing: Core starts at $750/month for brands under $5M impacted annual GMV and scales with GMV; Custom plan available
✅ Best fit: Mid-market and enterprise ecommerce brands consolidating multiple stores, ad platforms and business systems into a governed reporting layer.
🚫 Less ideal for: Small stores looking for a cheap plug-and-play profit dashboard or a simple last-click alternative.
🧩 Key capabilities
Dedicated Snowflake data warehouse
Ecommerce semantic layer
First-party pixel
Business intelligence and custom reporting
Broad ecommerce connector catalog
Incrementality testing and data activations on custom stacks
🔎 Official sources: Product · Pricing · Documentation / feature / integration

3. Northbeam
91/100 · 💰 Premium · 🧩 Advanced · 🏢 Mid-market–Enterprise · ⚙️ Specialist-led
🎯 Best for: Brands with substantial paid-media spend that need serious first-party attribution and advanced media measurement.
⚡ Choose Northbeam if paid media is a large enough line item that better attribution, view-through measurement and strategist support can justify a premium measurement stack.
Northbeam is a marketing-measurement platform designed for brands where paid-media allocation materially changes the P&L. It combines first-party multi-touch attribution with omnichannel dashboards, product analytics and advanced options such as media mix modeling, incrementality and conversion-feedback tooling. The product is less about general store reporting and more about answering where marketing dollars should move. That focus is valuable, but the price and learning periods make it a deliberate purchase rather than a lightweight analytics add-on.

📷 Northbeam reporting interface from official documentation, showing attribution and performance metrics used in media analysis. Source: official vendor website/documentation.
💚 What we like
First-party multi-touch attribution is designed around cross-channel media decisions rather than generic traffic reporting.
Professional and Enterprise plans support broad exports, integrations and more sophisticated refresh or regional requirements.
Media mix modeling, incrementality and strategist support create a path beyond deterministic attribution alone.
🟠 What to know
Starter is shown at $1,500 and Professional at $3,500 per month, so the value case depends on meaningful media spend.
Some models and features need 30, 60 or 90 days of learning data, which makes a one-week demo an incomplete test of the mature product.
💡 Why this score: Northbeam earns a top-tier score because its core job performance and advanced measurement depth are excellent for paid-media operators. It gives up points on pricing value and implementation friction. The closer media spend gets to a strategic capital-allocation problem, the stronger its relative case becomes.
💰 Pricing: Starter shown from $1,500; Professional $3,500/month; Growth and Enterprise are custom quote
✅ Best fit: Mid-market and enterprise direct-to-consumer brands with large multi-channel advertising budgets and dedicated growth or analytics ownership.
🚫 Less ideal for: Early-stage stores, low-spend teams or operators mainly seeking store profitability and customer-lifetime-value reporting.
🧩 Key capabilities
First-party multi-touch attribution
Click and view-through measurement
Omnichannel media dashboards
Product and creative analytics
Marketing mix modeling and incrementality options
Granular exports and custom ecommerce integrations
🔎 Official sources: Product · Pricing · Documentation / feature / integration
4. Rockerbox
89/100 · 💰 Enterprise price · 🧩 Advanced · 🏢 Mid-market–Enterprise · ⚙️ Enterprise implementation
🎯 Best for: Mature marketing teams that need multi-touch attribution, marketing mix modeling and incrementality within one measurement program.
⚡ Choose Rockerbox if you need a measurement framework spanning attribution, modeled media impact, experiments and data exports rather than a single ecommerce dashboard.
Rockerbox is positioned as a broader marketing-measurement system for teams that need to triangulate performance rather than treat one attribution model as truth. Its platform supports de-duplicated attribution views, multi-touch modeling, marketing mix modeling, incrementality and extensive marketing integrations. That breadth makes it useful for sophisticated media organizations, especially when teams want to export data into their own warehouse. It is less attractive for smaller merchants because pricing is sales-led and implementation is materially heavier.

📷 Rockerbox product interface shown inside the vendor’s official product imagery for cross-channel marketing measurement. Source: official vendor website/documentation.
💚 What we like
Multiple attribution views let teams compare first-touch, last-touch, even-weight and modeled multi-touch results.
The platform extends into marketing mix modeling and incrementality, reducing dependence on a single attribution methodology.
A broad integration catalog and data-export layer suit mature teams with their own analytics stack.
🟠 What to know
Rockerbox does not publish fixed plan prices, so buyers need a quote and should model total implementation and support cost.
The value comes from measurement discipline; teams without clean taxonomy, sufficient spend or analytical ownership may not use the platform deeply enough.
💡 Why this score: Rockerbox scores strongly on core measurement, integrations and scale because it supports several complementary methodologies. It falls below the top three mainly on buying friction and pricing transparency. For mature organizations that explicitly want triangulation rather than one attribution answer, it remains a serious shortlist candidate.
💰 Pricing: Custom quote
✅ Best fit: Mid-market and enterprise brands with multi-channel paid media, an analytics owner and a desire to combine attribution with modeled and experimental measurement.
🚫 Less ideal for: Small ecommerce teams that need fast store reporting, simple profit tracking or self-service pricing.
🧩 Key capabilities
De-duplicated marketing attribution
Four attribution views including modeled multi-touch
Marketing mix modeling
Incrementality measurement
150+ integrations and partnerships
Warehouse and reporting exports
🔎 Official sources: Product · Pricing · Documentation / feature / integration

5. Daasity
88/100 · 💰 Premium · 🧩 Advanced · 🏢 Mid-market–Enterprise · ⚙️ Enterprise implementation
🎯 Best for: Commerce teams that want a managed data-integration and analytics layer across marketing, finance and operations.
⚡ Choose Daasity if your hardest problem is consolidating ecommerce source data into a dependable business-intelligence model rather than picking one attribution model.
Daasity combines ecommerce data integration with a reporting layer designed around commerce metrics. It connects operational, marketing and store sources, then exposes dashboards for areas such as contribution margin, customer performance and site analytics. The platform is valuable when a brand needs a shared data foundation without staffing a full in-house data engineering function. It is not the cheapest route to dashboards, and its strengths show up most clearly when several teams need consistent source-of-truth reporting.
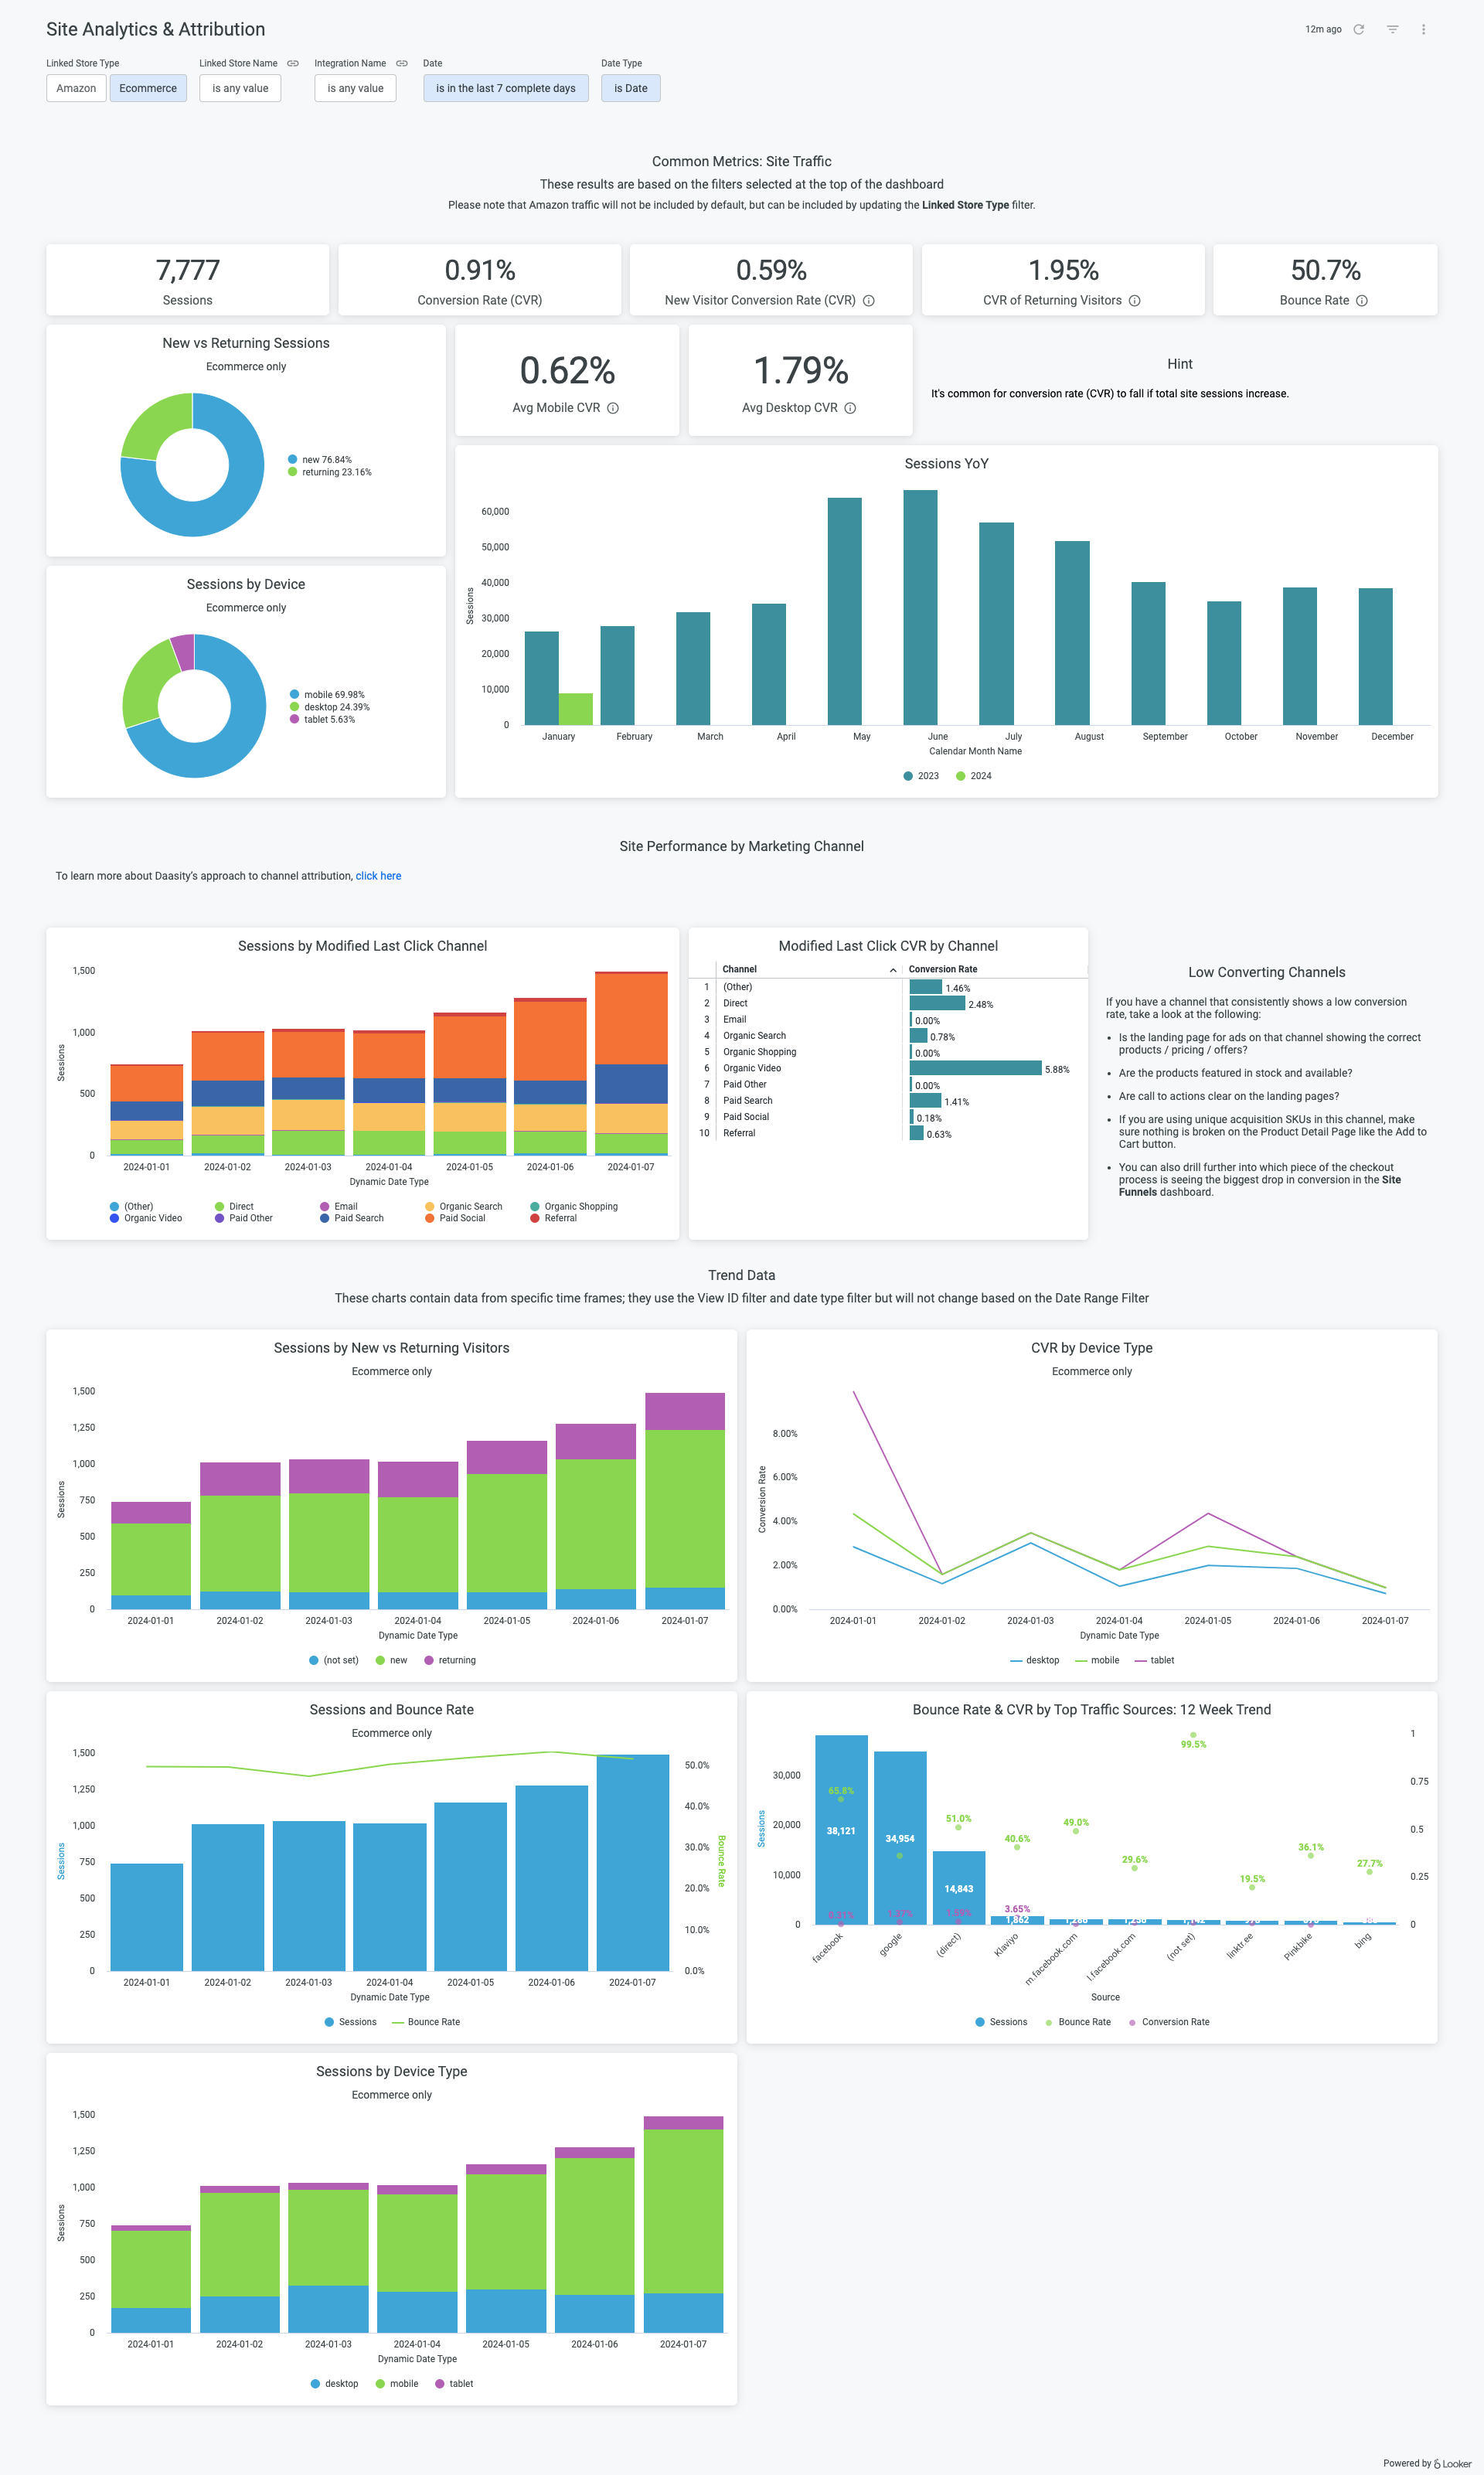
📷 Daasity ecommerce analytics interface from official help documentation, illustrating site and performance reporting. Source: official vendor website/documentation.
💚 What we like
Commerce-specific data modeling reduces the amount of raw transformation work compared with a general business-intelligence build.
Cross-functional reporting can connect marketing performance with margin, customer and operational data.
Enterprise configurations provide a path for more complex data integration and business requirements.
🟠 What to know
Current self-service pricing starts at $1,499/month, so teams should prove that multiple workflows will reuse the data foundation.
Implementation is more substantial than installing a single Shopify analytics app because source mapping and business definitions still need ownership.
💡 Why this score: Daasity scores high on ecommerce fit and integration depth, with solid scale for brands that need a shared analytical foundation. Its lower workflow and value scores reflect the heavier setup and premium price. It is strongest when replacing several disconnected reporting processes, not merely one dashboard.
💰 Pricing: Starter Essentials $1,499/month; Essentials $1,999/month; Enterprise custom quote
✅ Best fit: Mid-market ecommerce brands with several source systems and recurring reporting needs across growth, finance and operations.
🚫 Less ideal for: Small merchants wanting an inexpensive plug-and-play profit dashboard or teams focused only on paid-media attribution.
🧩 Key capabilities
Ecommerce data integration
Commerce-specific data models
Contribution-margin reporting
Customer and cohort analytics
Site analytics and attribution dashboards
Cross-functional business-intelligence reporting
🔎 Official sources: Product · Pricing · Documentation / feature / integration

6. Lifetimely by AMP
87/100 · 💰 Mid · 🧩 Intermediate · 🏢 SMB–Mid-market · ⚙️ No-code
🎯 Best for: Shopify-centric brands that want profit and customer lifetime value analysis without building a data warehouse.
⚡ Choose Lifetimely by AMP if you care more about daily profit, customer acquisition cost and lifetime value than sophisticated media-modeling methodology.
Lifetimely by AMP is an ecommerce analytics product centered on profitability and customer economics. It combines daily profit and loss reporting with predictive lifetime value, customer behavior, product performance, sales forecasts and channel attribution. Order-based pricing makes the economics easy to understand, and the free tier is useful for very small stores. It is less of an enterprise measurement laboratory than Northbeam or Rockerbox, but often more directly useful to an operator asking whether growth is actually profitable.
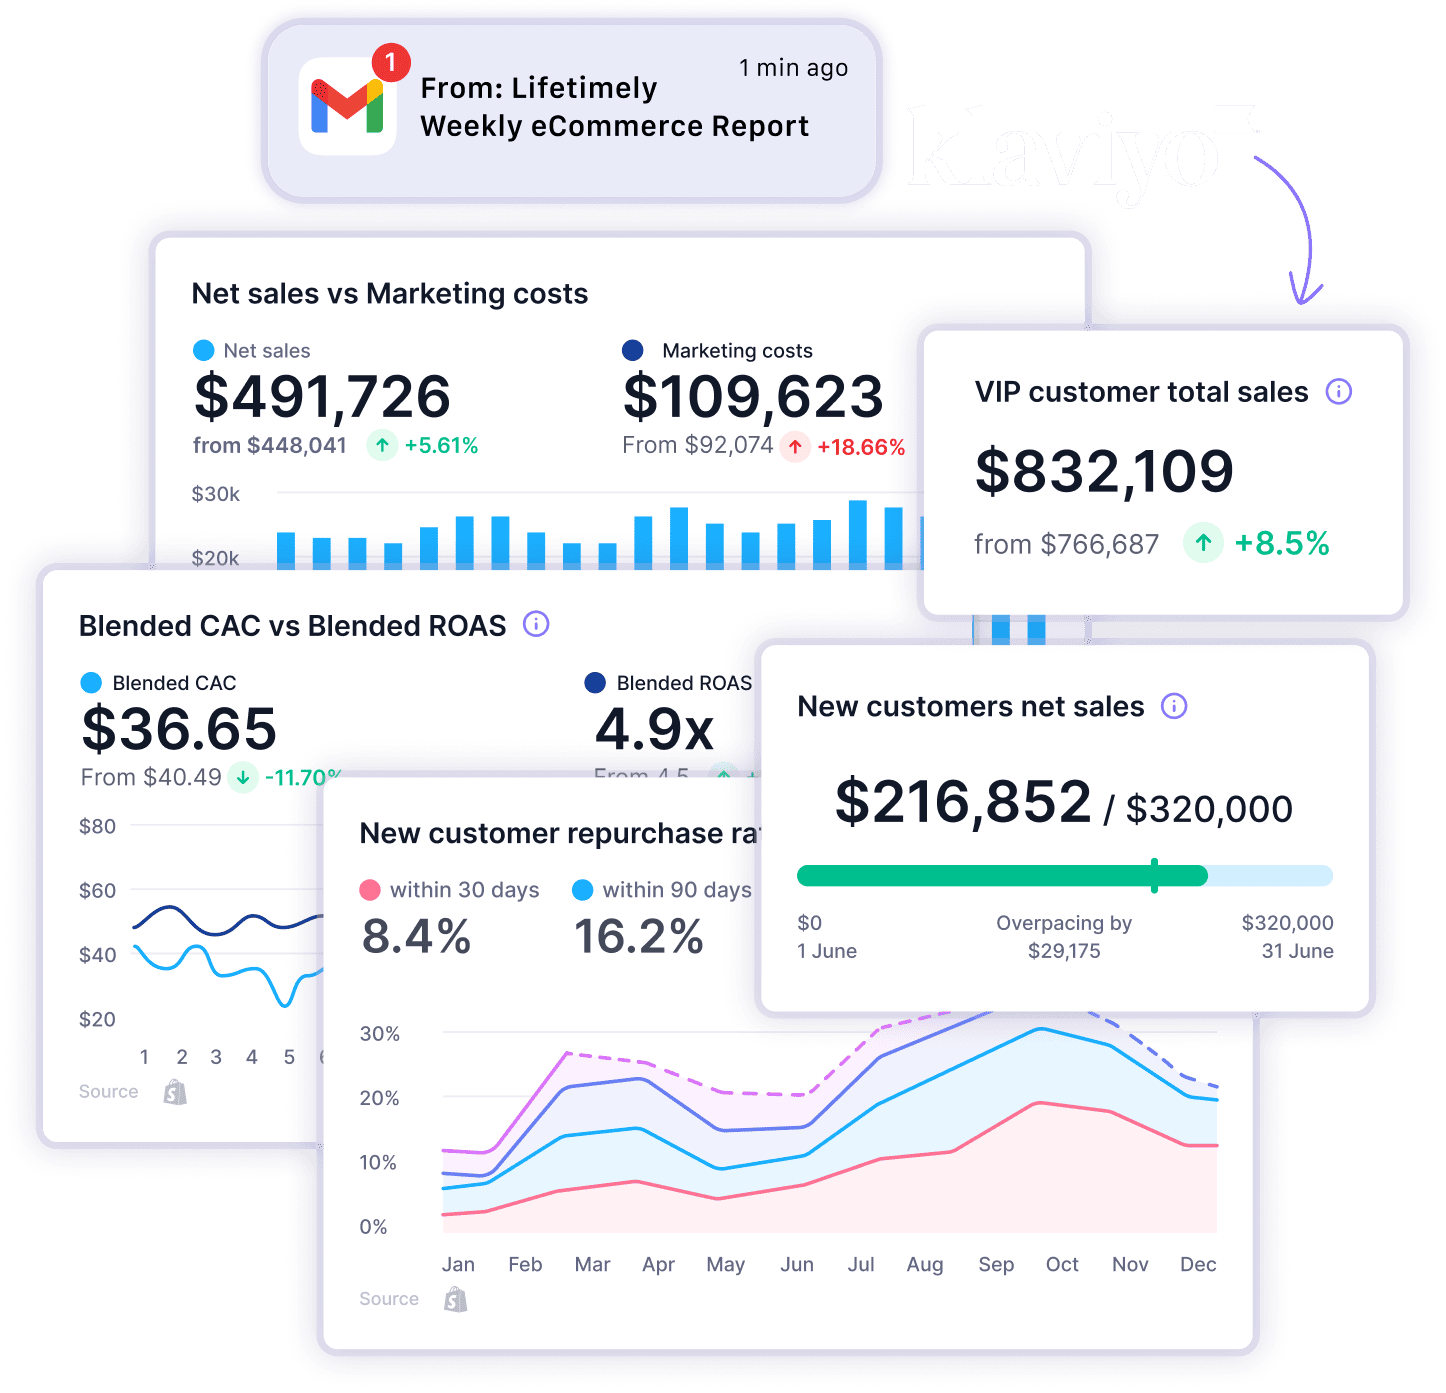
📷 Lifetimely custom-dashboard interface showing ecommerce profitability and customer metrics in one operating view. Source: official vendor website/documentation.
💚 What we like
Daily profit and loss combines revenue, costs, marketing spend and expenses in an operator-friendly view.
Predictive lifetime value and customer behavior analysis make retention economics visible without a custom model.
Order-based pricing is public and scales in understandable bands, with a meaningful free plan at very low volume.
🟠 What to know
The strongest fit is ecommerce profit and lifetime-value management, not rigorous media incrementality or a formal finance ledger.
Amazon data is a paid add-on on paid plans, so marketplace-heavy teams should include it in the total stack cost.
💡 Why this score: Lifetimely scores highly because it turns core ecommerce economics into a practical workflow at a relatively accessible price. It gives up points on enterprise scale and integration depth compared with data-platform products. For small and mid-sized operators, that simpler scope can be an advantage rather than a weakness.
💰 Pricing: Free below 50 orders/month; paid plans scale by orders, including M at $149/month through Unlimited at $999/month
✅ Best fit: Small and mid-market ecommerce brands that want daily profitability, customer lifetime value and cohort insight with limited technical setup.
🚫 Less ideal for: Large organizations needing a governed warehouse, deep custom data modeling or formal incrementality measurement across major media budgets.
🧩 Key capabilities
Daily profit and loss reporting
Predictive customer lifetime value
Customer acquisition cost and payback
Customer behavior and cohort analysis
Product performance and sales forecasting
Attribution and custom dashboards
🔎 Official sources: Product · Pricing · Documentation / feature / integration

7. Shopify Analytics
86/100 · 💰 Budget · 🧩 Beginner · 🏢 All sizes · ⚙️ No-code
🎯 Best for: Shopify merchants that need the cleanest native baseline for sales, sessions, products and store operations.
⚡ Choose Shopify Analytics if your store already runs on Shopify and the first question is what the platform itself can answer before adding another analytics subscription.
Shopify Analytics is the native reporting layer inside Shopify, so it starts with an advantage no external tool can fully reproduce: direct access to the store’s own operational data model. The current analytics experience includes a customizable overview, reports, data explorations, insights and near-real-time metrics. It is the right baseline for most Shopify merchants, but it is not a substitute for advanced cross-channel attribution, complete cost accounting or independent incrementality testing.

📷 Shopify Analytics interface showing native store reporting and performance metrics inside the Shopify environment. Source: official vendor website/documentation.
💚 What we like
Native access to Shopify sales, product, customer, session and fulfillment data removes a separate integration step.
The customizable dashboard and reports are understandable for non-technical operators and update quickly.
It is included with Shopify subscriptions, making it the rational baseline before buying overlapping reporting software.
🟠 What to know
Cross-channel marketing attribution and non-Shopify business costs are not the product’s primary job, so external tools may still be necessary.
Capabilities can vary by Shopify plan and data context, so teams should test the exact reports and custom explorations they expect to use.
💡 Why this score: Shopify Analytics earns exceptional ecommerce-fit and value scores because it is native, current and already paid for by Shopify merchants. It ranks below dedicated measurement platforms because cross-source methodology, cost completeness and advanced attribution are narrower. Treat it as the baseline every Shopify buyer should beat.
💰 Pricing: Included with Shopify; Basic starts at $29/month billed yearly ($39 month-to-month), with higher Shopify plans adding platform capabilities
✅ Best fit: Shopify merchants of any size that need native operational reporting before adding specialist profit, warehouse or attribution tooling.
🚫 Less ideal for: Brands on other commerce platforms or teams needing independent multi-touch attribution, marketing mix modeling or a cross-system profit model.
🧩 Key capabilities
Customizable analytics overview
Sales and transaction reporting
Product and merchandising reports
Customer and acquisition reporting
Live and near-real-time store metrics
Custom data explorations and report cards
🔎 Official sources: Product · Pricing · Documentation / feature / integration

8. Google Analytics 4
85/100 · 💰 Free · 🧩 Advanced · 🏢 All sizes · ⚙️ Developer-led
🎯 Best for: Teams that need free cross-site and app journey analytics, acquisition reporting and an extensible event model.
⚡ Choose Google Analytics 4 if you need a widely supported event analytics layer and are prepared to implement ecommerce events correctly rather than expecting profit reporting out of the box.
Google Analytics 4 (GA4) is a flexible event analytics system for websites and apps, with ecommerce reports covering product views, carts, checkouts and purchases once the required events are implemented. Its biggest strengths are cost, ecosystem reach, exportability and scale. Its biggest limitation in this comparison is equally important: GA4 is not a profit ledger and does not natively know all product costs, fulfillment expenses or incrementality effects simply because it can attribute traffic and conversions.

📷 Google Analytics ecommerce interface showing product and commerce performance inside the GA4 reporting environment. Source: official vendor website/documentation.
💚 What we like
The standard product is free and broadly integrated across advertising, site platforms and data workflows.
A flexible event model supports detailed customer-journey and ecommerce analysis when implementation is correct.
Enterprise-scale export and analysis options make GA4 useful as a data source even when another product becomes the operator dashboard.
🟠 What to know
Ecommerce events are not automatically collected on every site; Google states a developer needs to configure them unless the platform integration handles some events.
Revenue attribution inside web analytics should not be treated as complete contribution margin or causal incrementality without additional cost and experiment data.
💡 Why this score: GA4 receives huge value, integration and scale scores, but lower core-job and ecommerce-fit scores because this page compares more than traffic analytics. It is excellent plumbing and a useful baseline, yet serious profit and causal media questions normally require additional systems or modeling around it.
💰 Pricing: Standard Google Analytics is free; Analytics 360 is custom quote
✅ Best fit: Any ecommerce organization needing event-level web and app analytics, acquisition reporting and a widely supported source for downstream analysis.
🚫 Less ideal for: Operators expecting plug-and-play true-profit reporting, a finance-grade ledger or causal media measurement without implementation work.
🧩 Key capabilities
Ecommerce event measurement
Acquisition and traffic reporting
Customer journey explorations
Audience creation and advertising exports
Custom dimensions and metrics
Enterprise-scale data export options
🔎 Official sources: Product · Pricing · Documentation / feature / integration
9. sellerboard
84/100 · 💰 Budget · 🧩 Intermediate · 🏢 SMB–Mid-market · ⚙️ No-code
🎯 Best for: Amazon sellers that need inexpensive, detailed profit visibility around fees, advertising and inventory.
⚡ Choose sellerboard if Amazon is the center of your business and you want seller-specific profit analytics rather than a general direct-to-consumer reporting suite.
sellerboard is a specialist profitability tool for Amazon sellers. Its value comes from modeling the cost structure Amazon operators actually face: marketplace fees, advertising, refunds, cost of goods, indirect expenses and inventory. It also includes pay-per-click analysis, inventory tools and refund-related workflows. The product is narrower than the cross-channel leaders on this page, but that specialization can make it more useful and much cheaper for an Amazon-first business than buying a broader ecommerce data platform.
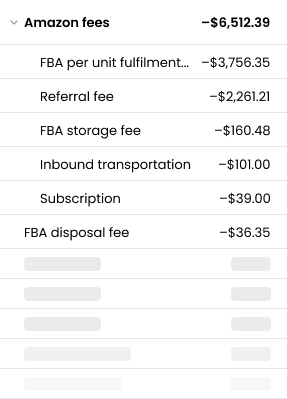
📷 sellerboard interface showing an Amazon fee and profitability breakdown used to explain net seller economics. Source: official vendor website/documentation.
💚 What we like
Amazon-specific profit calculations account for marketplace fees and seller economics that generic dashboards often miss.
Public pricing starts at a low monthly cost and scales through clearly defined plans.
Profit reporting is complemented by pay-per-click, inventory, alerts and refund-related workflows for Amazon operators.
🟠 What to know
The platform is fundamentally Amazon-centered, so it is not a general replacement for multi-store business intelligence or omnichannel attribution.
Account, order and product limits vary by plan; sellerboard states support tops out at 30,000 products.
💡 Why this score: sellerboard scores well because its Amazon-specific core job performance is excellent relative to price. It loses integration and scale points because the category is broader than Amazon profitability. For the right seller, the specialist scope is exactly why it belongs on the shortlist rather than a reason to avoid it.
💰 Pricing: Standard $19/month ($15 annual); Professional $29; Business $39; Enterprise $79; annual discounts available
✅ Best fit: Small and mid-market Amazon sellers that want a practical view of net profit, advertising, fees, refunds and inventory economics.
🚫 Less ideal for: Direct-to-consumer brands needing deep Shopify customer analytics or multi-channel marketing attribution across many paid and owned channels.
🧩 Key capabilities
Real-time Amazon profit dashboard
Marketplace fee and cost tracking
Pay-per-click profit analytics
Inventory management
Refund and reimbursement monitoring
Automated reports and alerts
🔎 Official sources: Product · Pricing · Documentation / feature / integration
10. BeProfit
83/100 · 💰 Premium · 🧩 Intermediate · 🏢 SMB–Mid-market · ⚙️ Low-code
🎯 Best for: Brands that want true-profit dashboards with product, order, shipping, returns and marketing cost analysis.
⚡ Choose BeProfit if your main question is where margin is leaking across products, orders, shipping, returns and marketing rather than which attribution model is theoretically best.
BeProfit is built around operational profitability. It brings revenue, cost, marketing, shipping, returns, discounts and custom expenses into a set of profit-focused reports, with additional views for lifetime value, products, orders and multi-store comparison. That makes it useful to founders and finance-minded operators who want to move from revenue reporting to contribution economics. The product is not a formal accounting ledger and its current pricing page does not expose a simple public rate card, so buyers should validate both cost and source coverage in a trial.
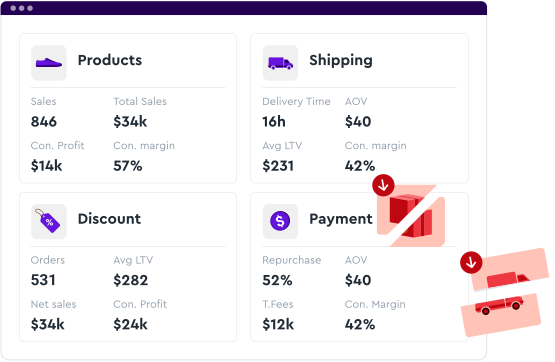
📷 BeProfit official feature imagery for real-time ecommerce profitability monitoring and performance analysis. Source: official vendor website/documentation.
💚 What we like
Profit reporting explicitly incorporates shipping, returns, discounts, marketing and custom expenses rather than stopping at revenue.
Product, order and store-comparison views help operators identify where contribution profit is being created or lost.
The vendor offers real-time performance and lifetime-value reporting alongside the core profit-and-loss view.
🟠 What to know
The current public pricing page does not expose fixed plan amounts, so buyers need a quote and should confirm exactly what determines price.
Profit accuracy depends on complete cost inputs and integrations; missing fulfillment or variable costs can make an attractive dashboard numerically misleading.
💡 Why this score: BeProfit scores well for ecommerce fit and practical profitability workflows, but its integration breadth, enterprise scale and pricing transparency are weaker than the leaders. It is a strong specialist option when the buyer’s core job is operating profit visibility rather than cross-channel causal measurement.
💰 Pricing: Custom quote; all plans include a 14-day free trial
✅ Best fit: Small and mid-market ecommerce businesses that want a dedicated profit operating view across costs, products, orders and marketing.
🚫 Less ideal for: Teams that primarily need advanced media attribution, marketing mix modeling, incrementality or a finance-grade general ledger.
🧩 Key capabilities
Live profit-and-loss reporting
Product and order profitability
Shipping and returns analysis
Retention and lifetime value
Marketing profit analysis
Custom expenses, revenue and data-sync options
🔎 Official sources: Product · Pricing · Documentation / feature / integration
11. Glew
82/100 · 💰 Enterprise price · 🧩 Advanced · 🏢 Mid-market–Enterprise · ⚙️ Specialist-led
🎯 Best for: Commerce teams that want broad KPI reporting, customer segmentation and a managed data pipeline option.
⚡ Choose Glew if you need cross-brand or cross-source ecommerce reporting and value a path from packaged dashboards into a managed data warehouse and Looker environment.
Glew spans two layers: packaged ecommerce analytics in Glew Pro and a more complete data pipeline, warehouse and reporting environment in Glew Plus. Pro includes hundreds of key performance indicators, customer segments and a focused integration set, while Plus adds managed extract-load-transform pipelines, a warehouse, Looker and many more integrations. That breadth can suit established brands, but opaque pricing and a heavier commercial motion make it less compelling for teams that only need a simple profit dashboard.

📷 Glew multi-brand data aggregation report from the official vendor site, showing cross-business ecommerce reporting. Source: official vendor website/documentation.
💚 What we like
Glew Pro includes a broad set of ecommerce performance indicators, customer segments and ready-made reporting.
Glew Plus adds a managed data pipeline, warehouse and Looker layer for teams that need a stronger analytical foundation.
Multi-brand and cross-integration reporting can reduce spreadsheet consolidation for more complex commerce organizations.
🟠 What to know
Glew does not publish a fixed Pro amount on the current pricing page and requires annual prepayment; Plus is custom-priced.
The product can overlap with both lighter ecommerce dashboards and heavier warehouse stacks, so buyers should define which layer they actually need before demoing.
💡 Why this score: Glew earns solid ecommerce-fit and integration scores, especially for cross-source reporting, but gives up points on pricing transparency, workflow simplicity and relative scale clarity. Its strongest case is a team that wants to graduate from packaged commerce dashboards toward a managed warehouse without assembling every component itself.
💰 Pricing: Custom quote; Glew Pro requires annual prepayment and Glew Plus has custom pricing
✅ Best fit: Mid-market and enterprise commerce teams needing multi-brand reporting, customer segmentation and optional managed data infrastructure.
🚫 Less ideal for: Small stores that need quick, low-cost profitability reporting or performance marketers focused primarily on advanced attribution methodology.
🧩 Key capabilities
250+ KPI reporting in Glew Pro
Customer segmentation
Marketing and product analytics
Managed extract-load-transform pipeline in Glew Plus
Data warehouse and Looker layer
Broad integration catalog on Glew Plus
🔎 Official sources: Product · Pricing · Documentation / feature / integration
12. ThoughtMetric
81/100 · 💰 Budget · 🧩 Intermediate · 🏢 SMB–Mid-market · ⚙️ Low-code
🎯 Best for: Smaller ecommerce brands that want straightforward multi-touch attribution with transparent entry pricing.
⚡ Choose ThoughtMetric if you want attribution and customer-journey reporting without the four-figure monthly starting point of enterprise measurement platforms.
ThoughtMetric focuses on accessible ecommerce marketing attribution. It includes multiple attribution models, configurable lookback windows, campaign and creative reporting, product analytics, customer journeys and broad commerce integrations, with pricing based on monthly pageviews. Starting at $99 per month, it gives smaller brands a practical way to move beyond ad-platform reporting. The trade-off is scale and methodological breadth: it is not positioned as the same kind of enterprise measurement program as Rockerbox or Northbeam.
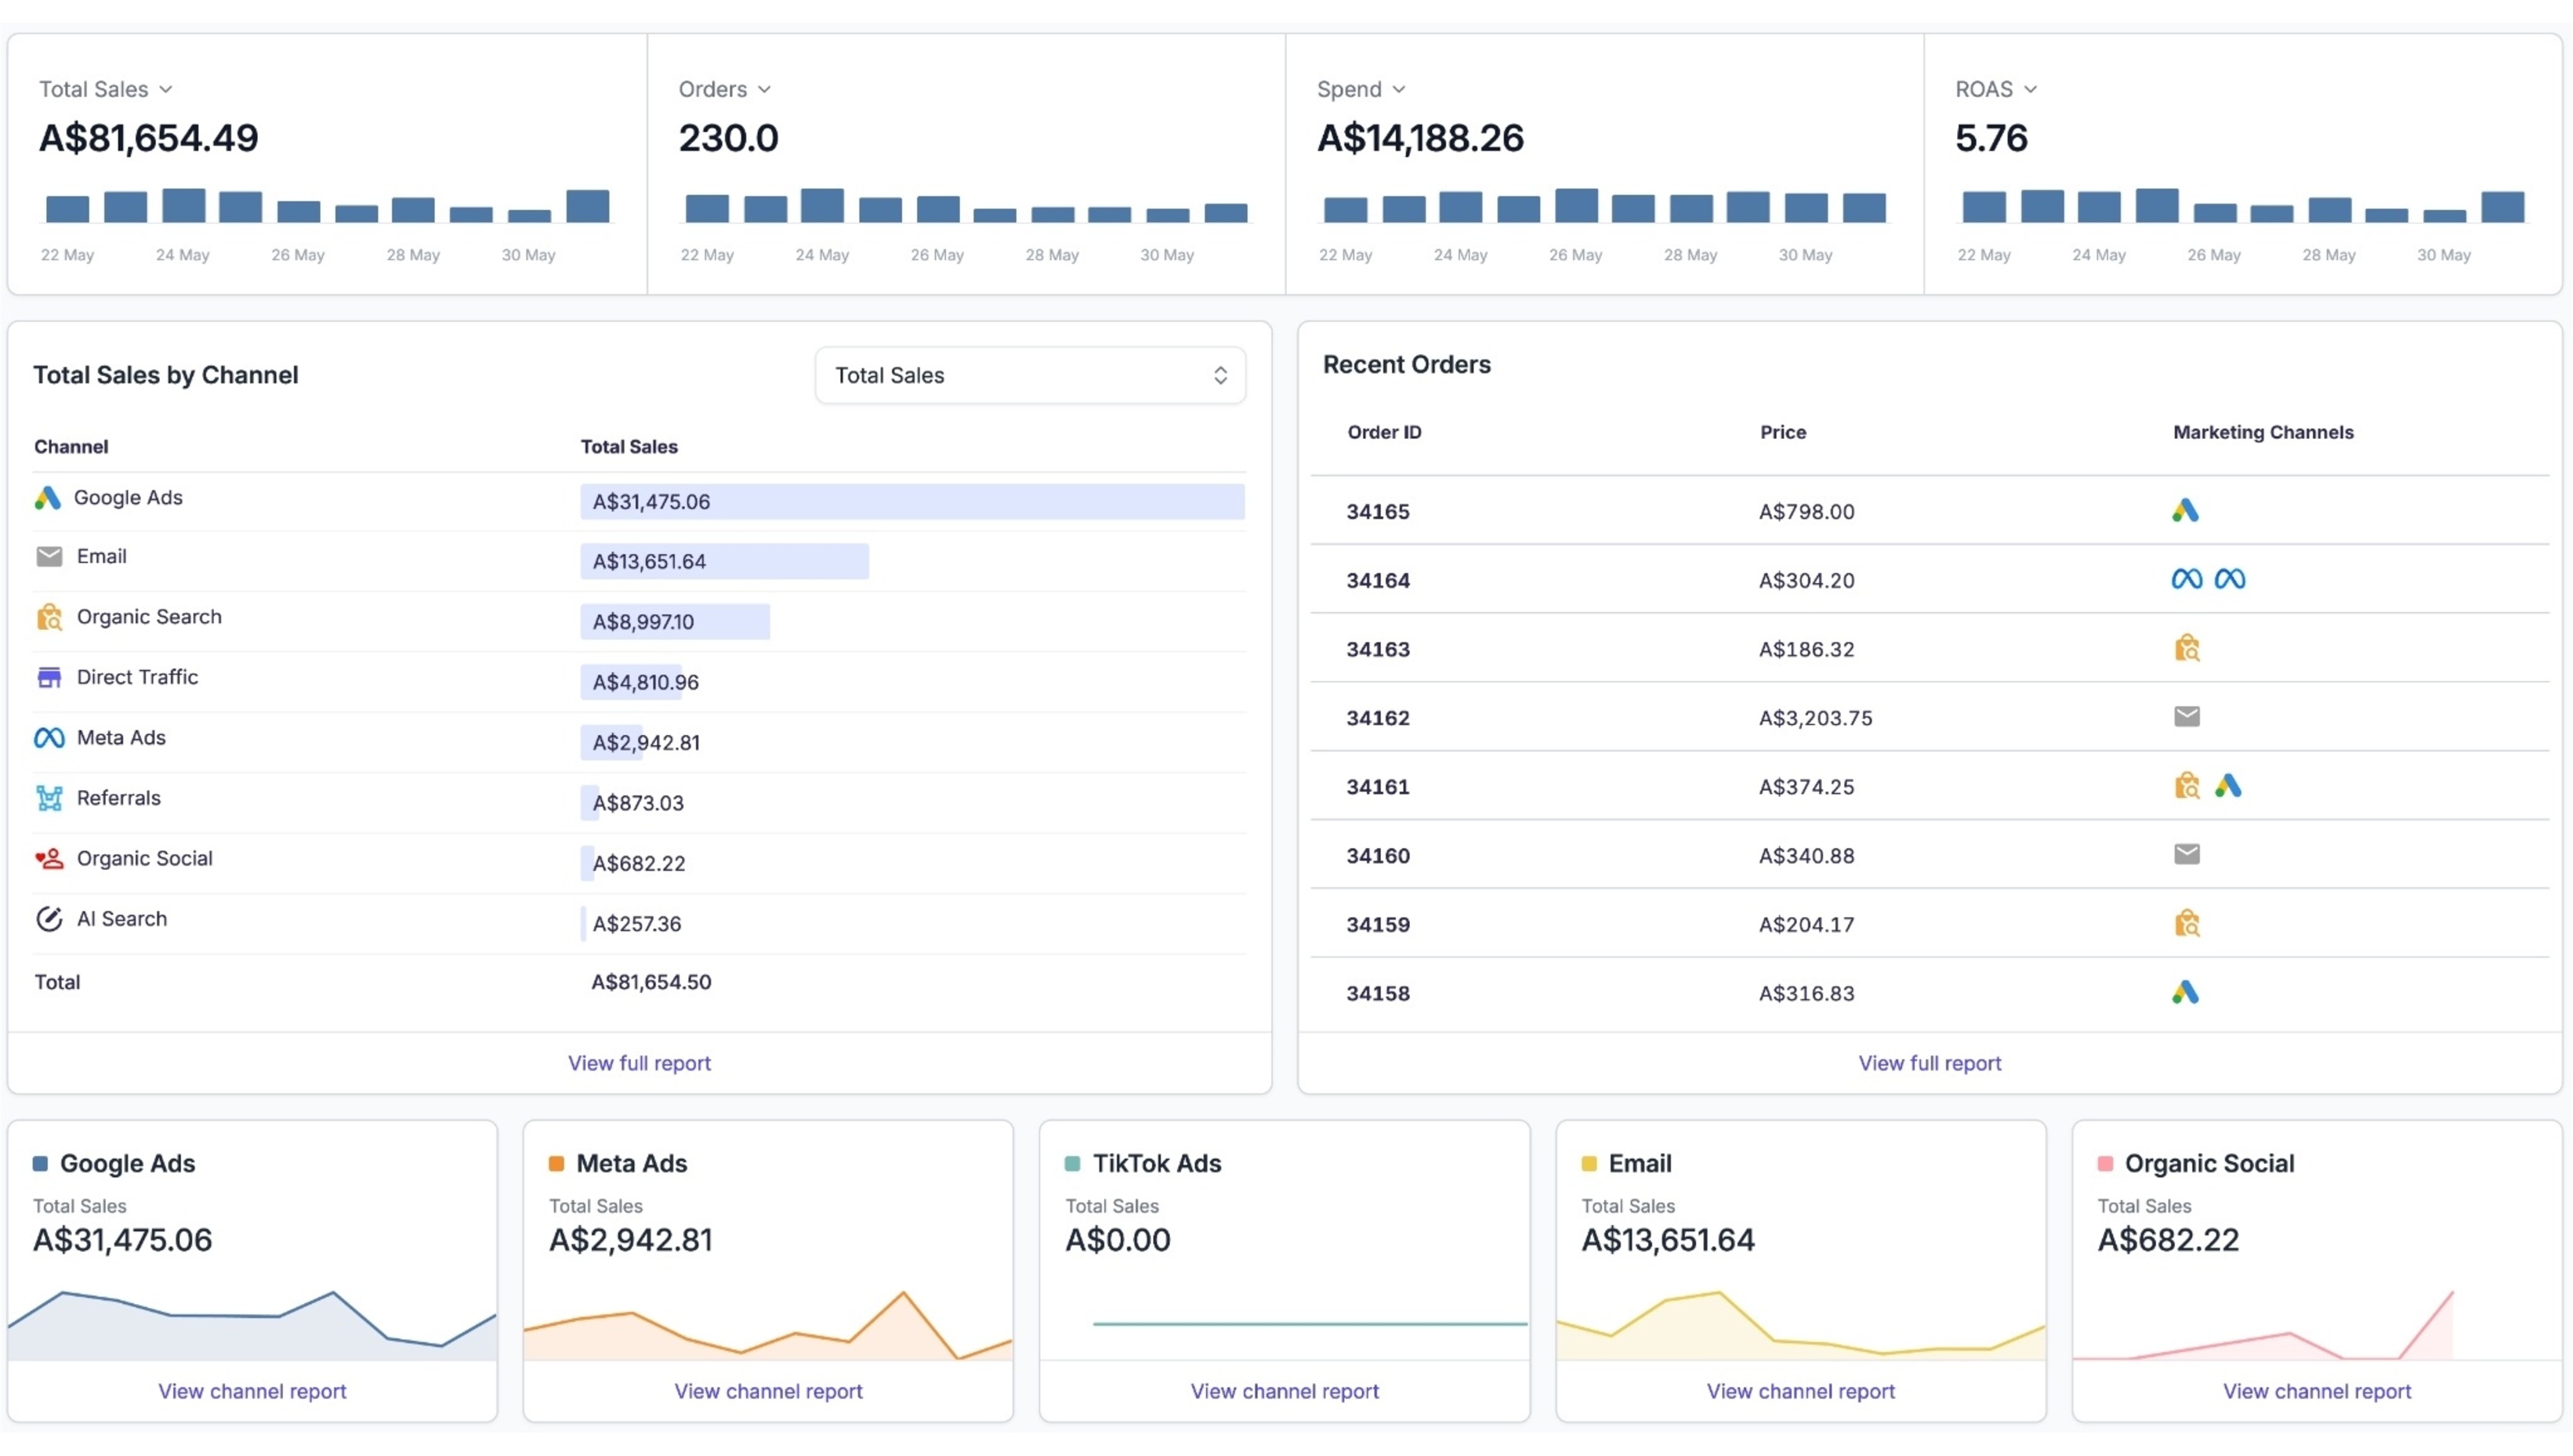
📷 ThoughtMetric attribution interface from the official product site, illustrating channel and customer-journey performance reporting. Source: official vendor website/documentation.
💚 What we like
Published pricing starts at $99/month and the vendor states every subscription includes the full feature set.
Five attribution models and configurable lookback windows let teams compare credit logic without buying higher feature tiers.
Ecommerce integrations and product/customer reporting keep the workflow closer to commerce operations than generic web analytics.
🟠 What to know
Pageview-based pricing still rises with traffic, so growing stores should model the cost at future volume rather than only today’s tier.
The product is strongest in attribution and journey reporting, not in enterprise data warehousing or advanced causal measurement such as full incrementality programs.
💡 Why this score: ThoughtMetric scores strongly on ecommerce fit and value because it brings a credible attribution workflow into a much lower price band. Its lower scale score keeps it below broader platforms. For smaller brands that need better marketing measurement now, that pricing-to-capability balance is the main reason to shortlist it.
💰 Pricing: From $99/month for 50,000 monthly pageviews; every feature included, with annual savings available
✅ Best fit: Small and mid-market ecommerce brands that need multi-touch attribution, customer journeys and campaign reporting with transparent entry pricing.
🚫 Less ideal for: Large enterprises that require deep data-governance controls, custom warehouse architecture or a full modeled-and-experimental measurement stack.
🧩 Key capabilities
Five attribution models
Configurable 7–90 day lookback windows
Multi-touch attribution
Campaign and creative performance
Product and customer analytics
Ecommerce and marketing integrations
🔎 Official sources: Product · Pricing · Documentation / feature / integration
🎯 Which tools should you actually shortlist?
If Shopify is your only store and the questions are basic: start with Shopify Analytics, then add Google Analytics 4 only if you need a richer cross-site acquisition and event layer.
If you want one ecommerce-native measurement hub: shortlist Triple Whale. It covers attribution plus a broader business-intelligence layer without forcing a full data-platform project on day one.
If paid media is a large capital-allocation problem: compare Northbeam and Rockerbox. Force both to show how attribution, modeled measurement and incrementality would change a real budget decision.
If your real problem is a fragmented data foundation: compare Polar Analytics and Daasity. Add Glew when multi-brand reporting or a managed warehouse path is especially important.
If profit and customer economics matter more than advanced attribution: compare Lifetimely by AMP and BeProfit. Amazon-first sellers should include sellerboard because marketplace fees and refunds materially change the calculation.
If you need a lower-cost attribution upgrade: ThoughtMetric gives smaller brands a clear entry point before four-figure monthly measurement platforms make economic sense.
🧪 Run this test before you buy
Take one completed 30-day period and make every shortlisted vendor explain the same business. Use a month with a promotion, refunds, at least two paid channels and one operational anomaly. Provide the same store revenue, advertising spend, cost-of-goods data and channel tags wherever the product supports them. Do not let vendors choose the cleanest date range. The objective is not to make every number match; it is to understand why numbers differ, which assumptions are editable and whether the product can support a repeatable weekly decision process.
Load the same 30-day period and reconcile total orders and revenue to the commerce platform before discussing attribution.
Compare new versus returning customers and verify how each product defines the customer identity across devices and channels.
Enter product cost, shipping, fulfillment, returns and discounts where supported, then reconcile contribution profit on five sample orders.
Pick one Meta campaign and one Google campaign and compare attributed revenue across each available model and lookback window.
Inspect one conversion path with several touches and ask the vendor to explain exactly why each touch received credit.
Include one offline, influencer or non-click channel and test how the tool handles missing deterministic touchpoints.
Change one attribution window or cost assumption and record how quickly the dashboards, exports and historical numbers update.
Export the underlying data needed to recreate one executive metric outside the platform and note what is unavailable or transformed.
Ask how the same month would be measured if cookies, channel identifiers or a source integration were partially missing.
Model three times current order volume and advertising spend, then calculate the future subscription, implementation and data-stack cost.
📏 Record the same things for every vendor: revenue reconciliation gap, unexplained cost gap, attribution delta versus ad platforms, time to usable data, manual mapping steps, refresh latency, export quality, model transparency, number of stakeholders required for upkeep and total monthly cost at today’s and three-times-today’s volume.
🧾 10 questions to ask in every demo
Which business question are you designed to answer best: native store performance, profit economics, attribution, marketing mix modeling or incrementality?
Exactly which revenue, cost and customer fields do you ingest from our commerce platform, and which costs must we maintain manually?
How do you identify customers and de-duplicate conversions across browsers, devices, channels and repeat purchases?
Which attribution models and lookback windows can we control, and which parts of the methodology are proprietary or fixed?
How do you handle view-through exposure, offline channels, influencer activity and conversions without a deterministic click?
What is your data refresh latency for store, advertising and cost data, and what happens when an integration is delayed?
What determines price: gross merchandise value, pageviews, orders, advertising spend, stores, users, data history or implementation services?
What implementation work is required from engineering, analytics, finance and marketing before the first trustworthy report?
Can we export raw and modeled data, metric definitions and historical reports in usable formats if we build our own warehouse or leave?
When your number disagrees with Shopify, Google Analytics or the ad platform, what diagnostic workflow explains the difference and who owns the fix?
❓ Frequently asked questions
What is ecommerce analytics software?
Ecommerce analytics software combines store, customer, product and often marketing data so operators can understand performance and make decisions. Some products stay close to native store reporting, while others add profitability, customer lifetime value, attribution or a full data platform. The category name is broad, so the first buying step is defining which measurement job you actually need.
What is the difference between profit tracking and attribution?
Profit tracking asks what money remains after relevant costs such as product cost, shipping, discounts, returns and marketing. Attribution asks which marketing touchpoints should receive credit for a conversion. They can use the same revenue data, but they are not the same model and neither automatically proves causal impact.
Is Google Analytics 4 enough for ecommerce?
Google Analytics 4 can be enough for website and app journey analysis, acquisition and properly implemented ecommerce events. It is not automatically a complete profit system because it does not know every business cost, and it is not an incrementality experiment. Many brands keep GA4 as a source while using a specialist profit or attribution layer for other decisions.
Do Shopify merchants need a separate analytics tool?
Not always. Shopify Analytics is the sensible baseline because it is native and included with the platform. A separate tool starts to make sense when cross-channel attribution, complete cost allocation, customer lifetime value, multi-store reporting, warehousing or experimental measurement creates a decision that Shopify alone does not answer well.
How much do ecommerce analytics and attribution tools cost?
The range is wide. GA4 is free in its standard edition, sellerboard starts below $20 per month, ThoughtMetric starts at $99, Lifetimely publishes order-based tiers, and enterprise measurement platforms can begin around four figures per month or require a quote. Compare total stack cost, including implementation and data work, not only subscription price.
What is incrementality and why does it matter?
Incrementality estimates what outcomes happened because of an intervention, compared with what would have happened anyway. Attribution distributes credit across observed touchpoints, which is useful operationally but not inherently causal. Larger media teams often combine attribution with experiments or marketing mix modeling rather than treating one dashboard as absolute truth.
🔍 About this research
MarketMaze researched and scored each assigned product using the fixed six-dimension methodology above. Pricing, implementation details, product capabilities and integrations were checked against official vendor sources only. Screenshots are first-party product interfaces or official documentation/feature imagery and were visually reviewed to exclude cookie banners, consent walls, login walls, error pages, generic stock photography and fake interfaces.
Last research check: 26 September 2026.
